PowerTOP – Analyze and Manage Power Consumption in Linux
One of the most important characteristics of a good Linux machine especially with laptops is power management in terms of prolonging battery life.
Linux has utilities that can help you monitor and keep track of your battery performance, though many of us still face problems in getting the right power settings to manage power consumption and improve battery life.
In this article we are going to look at a Linux utility called PowerTOP that helps you to get the appropriate system settings to manage battery power on your Linux machine.
What is PowerTOP?
PowerTOP is a terminal-based diagnosis tool developed by Intel that helps you monitor power usage by programs running on a Linux system when it is not plugged into a power source.
An important feature of PowerTOP is that it provides an interactive mode that allows a user to experiment with different power management settings.
Requirements
PowerTOP requires the following components:
- Development Tools such as C++, g++, libstdc++, autoconf, automake, and libtool.
- In addition to the above, it also requires pciutils-devel, ncurses-devel, and libnl-devel components
- kernel version => 2.6.38
How to Install Powertop in Linux
PowerTOP can be easily installed from the default system repositories using your respective package manager for your specific Linux distribution.
sudo apt install powertop         [On Debian, Ubuntu and Mint]
sudo yum install powertop         [On RHEL/CentOS/Fedora and Rocky/AlmaLinux]
sudo emerge -a sys-apps/powertop  [On Gentoo Linux]
sudo apk add powertop             [On Alpine Linux]
sudo pacman -S powertop           [On Arch Linux]
sudo zypper install powertop      [On OpenSUSE]
sudo pkg install powertop         [On FreeBSD]
Important: Please note that installing Powertop from the default system repositories will get you an older version.
If you’re looking to install the most recent version (i.e. v2.15 released on 29 Sep 2022) of Powertop, you have to build it and install it from the source, for this, you must have the following dependencies installed on the system.
------------------- On Debian based Systems -------------------
sudo apt install build-essential ncurses-dev libnl-dev pciutils-dev libpci-dev libtool
------------------- On RedHat based Systems -------------------
sudo dnf install gcc-c++ ncurses-devel libnl-devel pciutils-devel libtool
After installing all the above required packages, now it’s time to download most latest version of PowerTop and install it as suggested:
wget https://github.com/fenrus75/powertop/releases/download/v2.15/powertop.tar.gz
tar -xvf powertop.tar.gz
cd powertop/
./configure
sudo make && make install
How Do I use PowerTop in Linux?
To use this tool, one needs root privileges because all the information required by Powertop to measure power usage by applications is gathered directly from the system hardware.
Try to use it with laptop battery power to see the effects on the system. It shows the total power usage by the system and by the individual components of the system listed in different categories: devices, processes, system timer, kernel works, and interrupts.
Understanding PowerTop Options and Usage
To set all the tunable options to the best settings without the interactive mode, use the --auto-tune option.
To run it in calibration mode, use the --calibrate option. If you run Powertop on a laptop battery, it tracks power consumption as well as processes running on the system and after getting enough power measurements, it reports power estimates.
You can then use this option to get more appropriate estimates when using this option, to implement a calibration cycle through different display levels and workloads.
To run it in debug mode, use the --debug option.
You can also generate a report for data analysis by using the --csv=filename. The report generated is called a CSV report and when you do not spell out a file name, a default name powertop.csv is used.
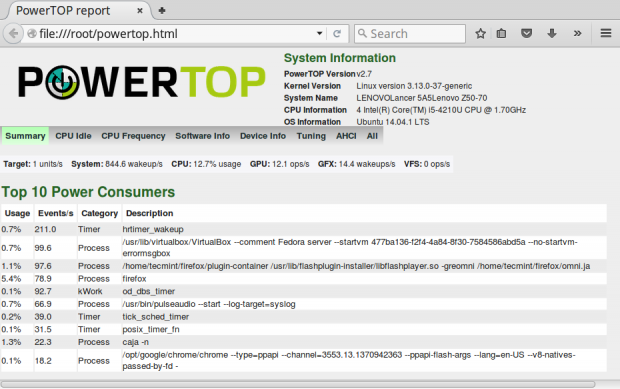
To generate a html report file, use the --html=filename option. You can specify for how long in seconds a report can be generated by using the --time=seconds.
You can specify a workload file to execute as part of the calibration before generating a report by using the --workload=workload_filename.
To show help messages use the --help option or view the manpage.
To specify the number of times a test should be run by using the --iteration option.
PowerTop Usage with Examples
If you run Powertop without any of the above options, it starts in an interactive mode as shown in the output below.
powertop
The overview screen
This display screen allows you to view a list of the system components that are either sending wake-ups to the CPU most frequently or are using the most power on the system.

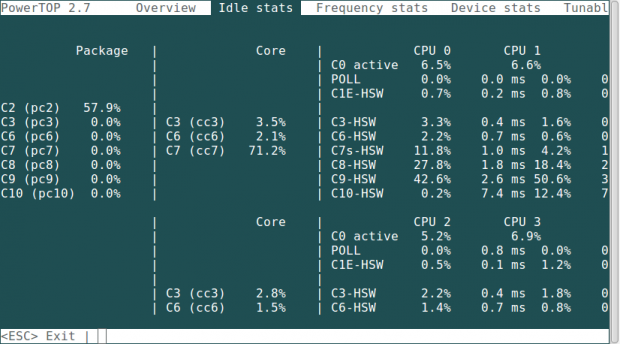
The Idle stats screen
It displays various information about processor C-states.
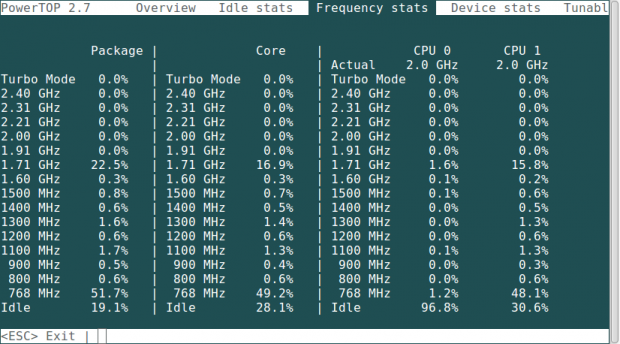
The Frequency Stats screen
This screen displays the frequency of wake-ups to the CPU.
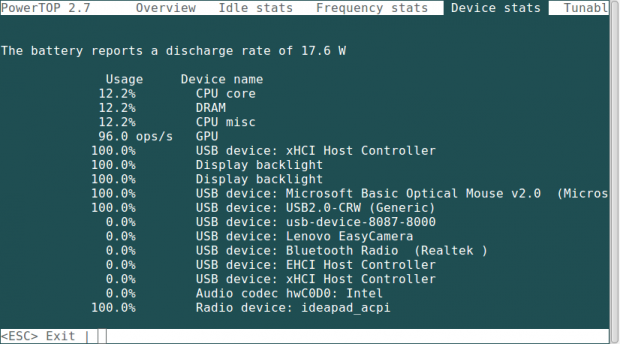
The Device stats screen
It provides information similar to the Overview display screen but only for devices.
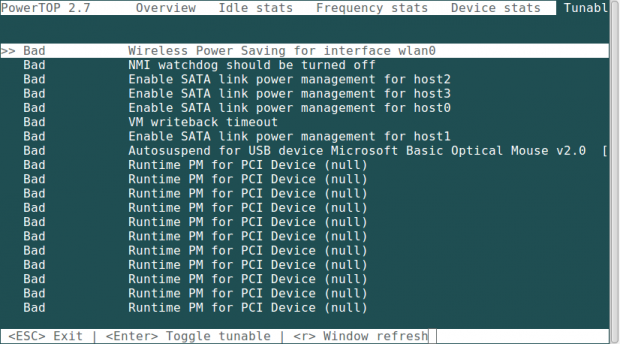
The Tunables screen
It provides suggestions for optimizing your system for good power consumption.
As you can see from the output above, there are different display screens available and to switch between them, you can use Tab and Shift+Tab keys. Exit the powertop by pressing the Esc key as listed at the bottom of the screen.
It displays the number of times your system wakes up each second, when you view the device stats display screen, it shows statistics of power usage by different hardware components and drivers.
To maximize battery power, you have to minimize system wake-ups. To do this, you can use the Tunables display screen.
“Bad” identifies a setting that is not saving power, but may be good for the performance of your system.
Then “Good” identifies a setting that is saving power. Hit the [Enter] key on any tunable to switch it to the other setting.
The example below shows the output when using the --calibrate option.
# powertop --calibrate
After the calibration cycles, the powertop will show the overview screen with a summary of operations as below.
Generating PowerTop CSV Report
The next example shows generating a CSV report for twenty seconds.
powertop --csv=powertop_report.txt --time=20s
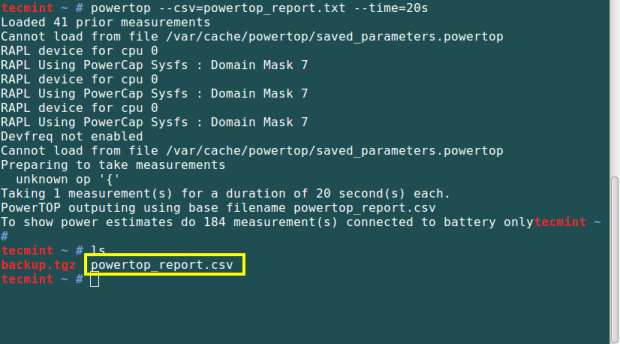
Now let’s view the CSV report using the cat command.
cat powertop_report.csv
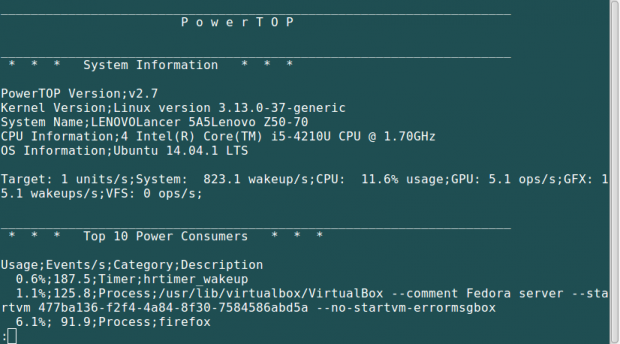
Generate PowerTop HTML Report
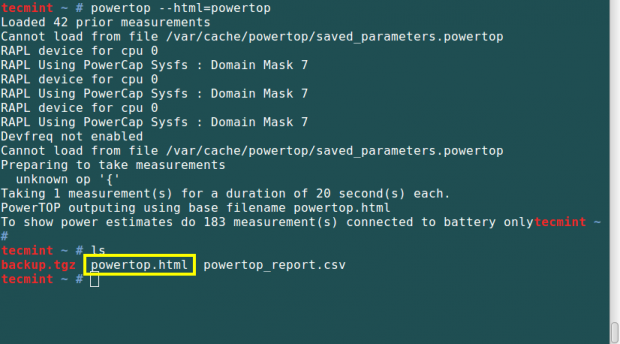
You can generate an html report as follows, the html file extension is added automatically to the filename.
powertop --html=powertop
The sample html report file is viewed from a browser.
This tool also has a daemon service that helps to automatically set all tunables to “Good” for optimal power saving, and you can use it as follows:
systmctl start powertop.service
To make the daemon service start at boot time, run the following command:
# systemctl enable powertop.service
Summary
You need to take caution when using daemon service because certain tunables pose a risk of data loss or weird system hardware behavior. This is evident with the “VM writeback timeout” settings that affect the time your system waits before writing any changes of data to the actual disk.
When the system loses all its power, then you risk losing all changes made on data for the last few seconds. Therefore you have to choose between saving power and securing your data.
Try to use this tool for some period of time and observe the performance of your battery. You can post a comment to tell us about many other similar tools or add information on the usage of Powertop, and about errors you encountered.
Remember to always stay connected to Tecmint to get more of such guides.


